Kangamall Research finds higher prices accounted for more than half of the growth in Australian household spending in 2025–26
Nov 19, 2026
Kangamall Research's Australian Spending Report 2026 finds household consumption rose 5.3% to A$1.54 trillion in 2025–26, while its volume rose 2.2%, so higher prices accounted for more than half of the growth.
Sydney, Australia, November 19, 2026 -- Sydney, NSW, Australia – November 20, 2026 – Higher prices accounted for more than half of the growth in Australian household consumption spending in 2025–26, according to the Australian Spending Report 2026 released by Kangamall Research. Household final consumption expenditure, the national accounts measure of what households spend on goods and services, rose 5.3 per cent to A$1.54 trillion. The volume of that consumption, which removes the effect of price changes, rose 2.2 per cent, and the implicit price of consumption rose 3.0 per cent.
The report analyses the Australian Bureau of Statistics (ABS) annual national accounts for 2025–26, released on 23 October 2026. It sets out how national consumption is divided across 12 categories (price and volume are tracked for eight of them), how those shares have changed since 2015–16, and where prices rose faster than volumes. Every share and change is calculated from the same revised ABS release, so that statistical revisions are not mistaken for economic change.
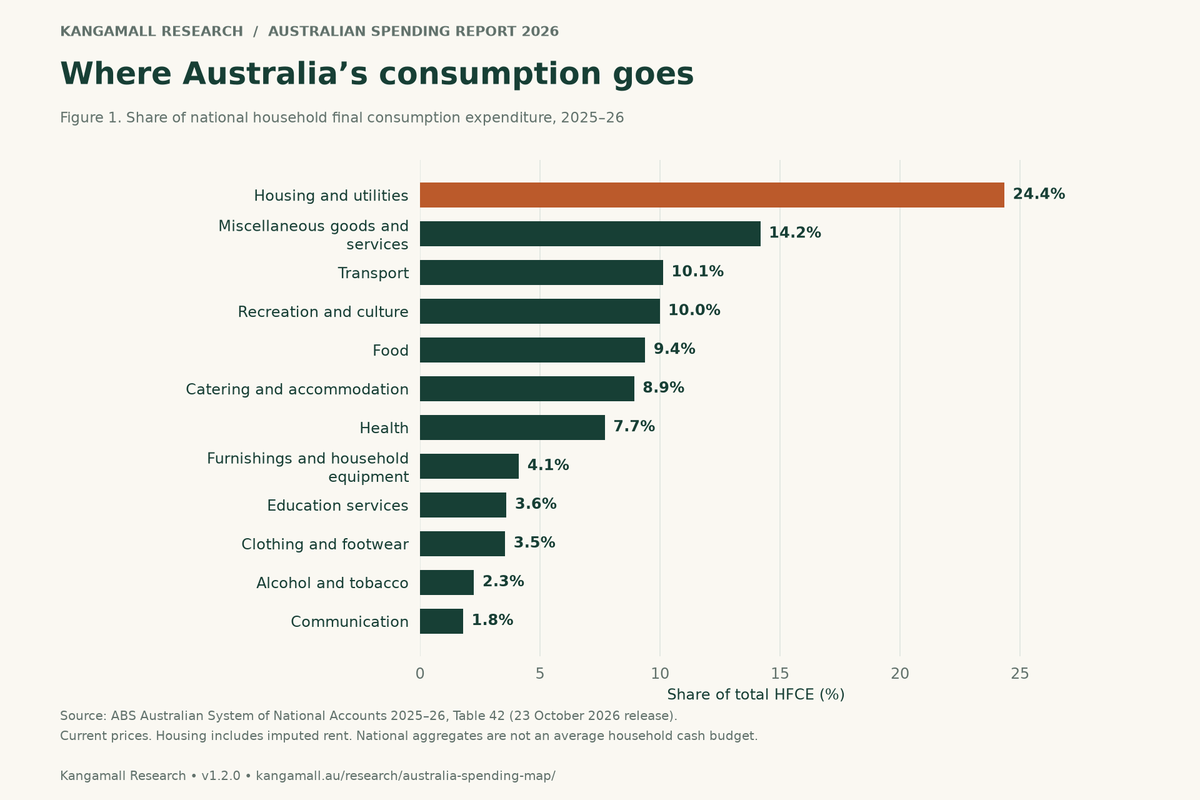
Shares of Australian household consumption by category, 2025–26. Source: Kangamall Research, from ABS data.
Spending grew faster than volume in all eight categories tracked
The report tracks price and volume for eight categories, and in all of them spending grew faster than volume. The gap was widest for education services, where spending rose 6.9 per cent and volume 1.9 per cent. Health spending rose 7.9 per cent against volume growth of 4.7 per cent. Actual rent and the imputed rent of owner-occupiers each rose 6.0 per cent in spending and 1.6 per cent in volume. Food spending rose 4.4 per cent with volume up 2.5 per cent, and transport spending rose 2.8 per cent with volume up 1.0 per cent.
A quarter of consumption goes on housing and utilities
Housing and utilities took 24.4 per cent of household consumption in 2025–26, or A$374.6 billion. Miscellaneous goods and services, an ABS grouping that includes insurance and financial services, took 14.2 per cent, followed by transport at 10.1 per cent and recreation and culture at 10.0 per cent. Food took 9.4 per cent and education services 3.6 per cent.
Two-thirds of housing consumption is imputed rent
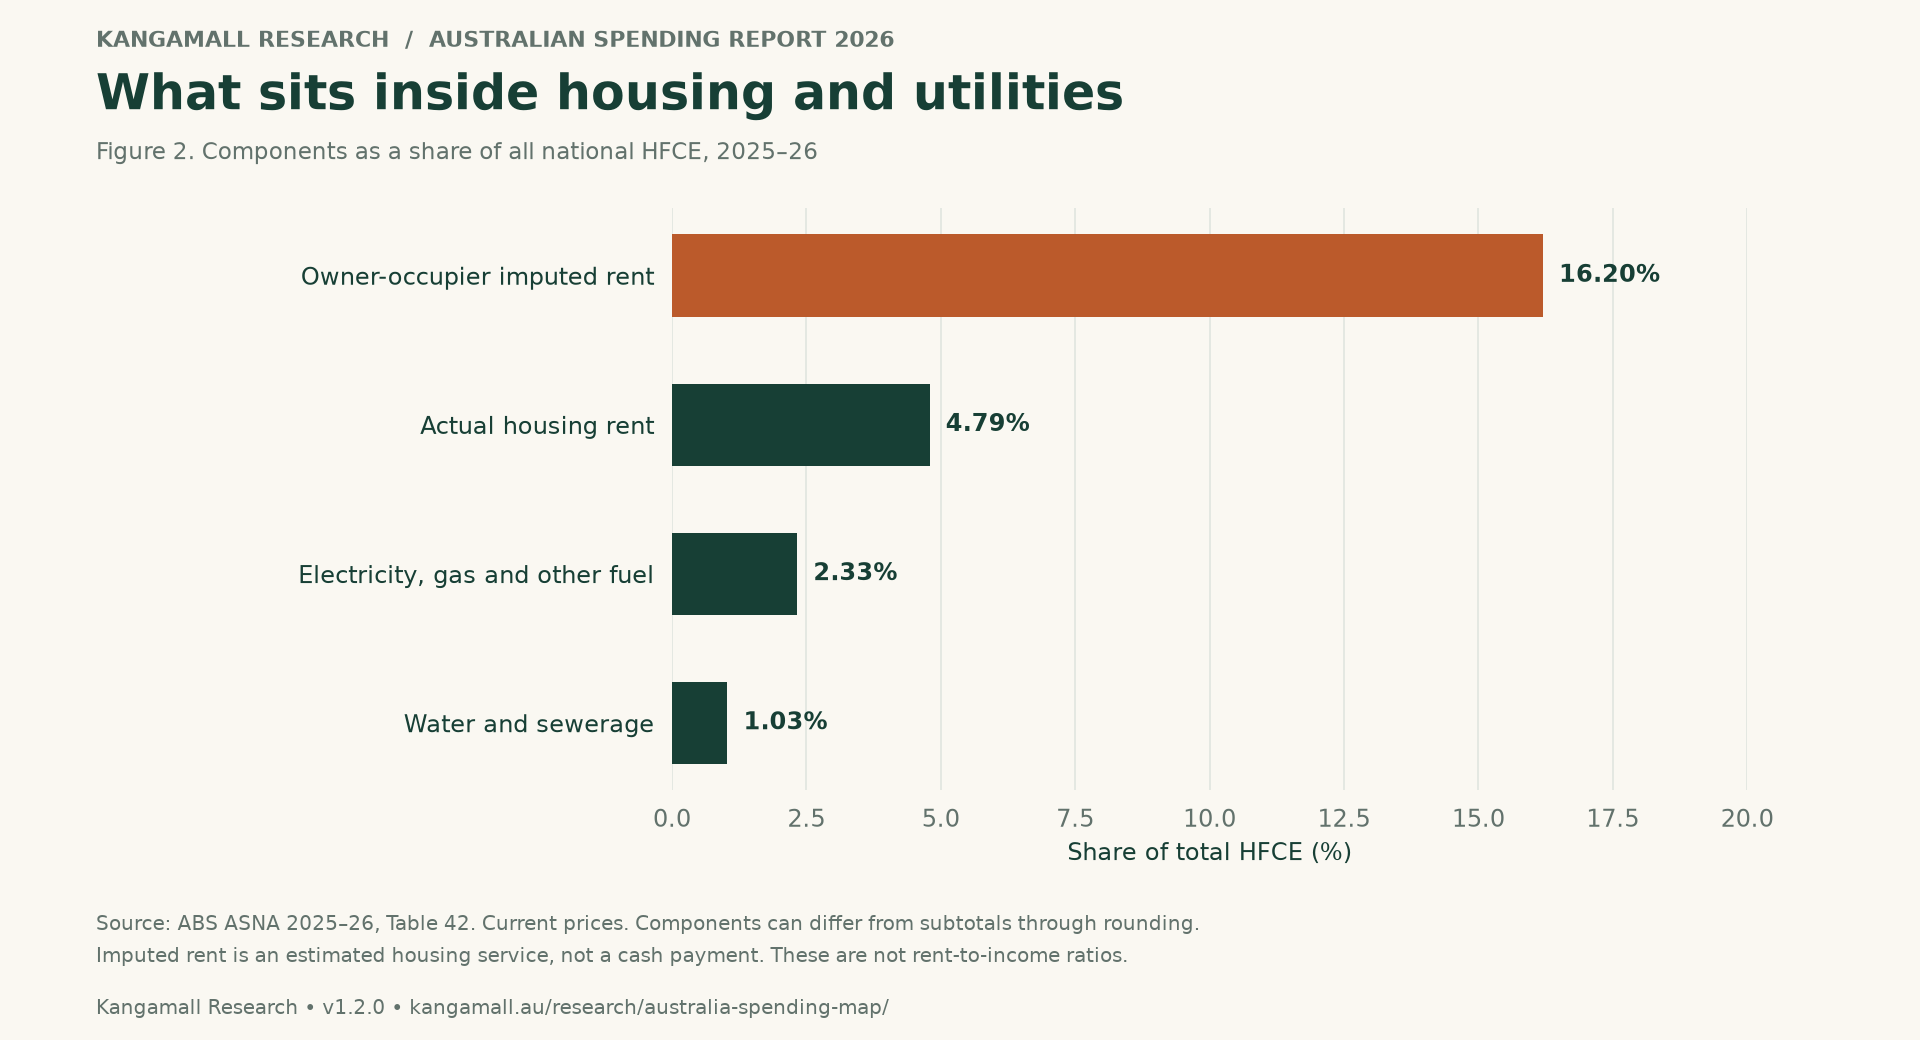
Of the housing total, A$249.2 billion is imputed rent: the estimated value of living in a home the occupant owns, which national accounts count as consumption so that owning and renting are treated alike. Rent actually paid to landlords came to A$73.7 billion. The figures exclude mortgage repayments and home purchases, and they cannot show how much of a renter's income goes on rent.
Catering, accommodation and health gained share over the decade
Between 2015–16 and 2025–26, the share of consumption spent on catering and accommodation rose 1.55 percentage points, the largest gain of any category. Housing and utilities rose 1.27 points and health 0.70 points. Food purchases came to A$144.4 billion and catering to A$91.6 billion in 2025–26, together 15.3 per cent of household consumption.
"Australians spent more last year, but much of the increase bought the same things at higher prices. Separating price from volume, and imputed rent from rent that is actually paid, gives households, businesses and policymakers a clearer view of where the money goes," said Richard Lee, CEO of KangaMall Australia.
About the research
The report uses ABS Table 42 of the Australian System of National Accounts, 2025–26, in current prices and chain volume measures. The figures describe national household consumption, including non-cash items such as imputed rent and spending by non-profit institutions serving households, so they are not the budget of a typical family. Domestic household travellers' spending of A$146.7 billion in 2024–25, from the ABS Tourism Satellite Account, is reported separately because it overlaps the national categories. The full report, with four charts, the extracted data and a source reference for every figure, is available on the Kangamall website.
About KangaMall Australia
KangaMall Australia is an Australian research and consumer information platform. Kangamall Research publishes independent analysis of everyday life in Australia, including the Australian Spending Report 2026 and the Australian Time Use Report 2026, alongside practical guides for households. More information is available at kangamall.au.
Contact Info:
Name: Richard Lee
Email: Send Email
Organization: KangaMall Australia
Address: Sydney, NSW, Australia
Phone: +61 405 906 868
Website: https://kangamall.au
Release ID: 89210218
If you encounter any issues, discrepancies, or concerns regarding the content provided in this press release, or if there is a need for a press release takedown, we urge you to notify us without delay at [email protected] (it is important to note that this email is the authorized channel for such matters, sending multiple emails to multiple addresses does not necessarily help expedite your request). Our expert team will be available to promptly respond within 8 hours – ensuring swift resolution of identified issues or offering guidance on removal procedures. Delivering accurate and reliable information is fundamental to our mission.
More News


Recommended


What are Anthropic’s financials?


YOUR NEWS, OUR NETWORK.
Do you have Great News you want to tell the world?
Be it updates about your business or your community, you can make sure that it’s heard by submitting your story to our network reaching hundreds of news sites across 6 verticals.